| INDEX |
| INDEX |

 "BIOSONIC"FREQUENCIES
The most
important feature we want to test is to trust the frequencies we are collecting,
and for that reason we need to trust the program we are using and know
that we can trust the techonological programming of the BioSOnic system
and the ethical and integral standards of Proinfo. We are using an advanced
computer technology and we have never before understood the mathematical
vibrational nature of the VOICE. It is our means of communication
and our constant level of energy letting persons in to interact with us,
or putting barruers to keep the persons and other beings out of our auric
fields.
Frequencies are the most exact
measurement or that phenomena that needs to be studied with carefull attention.
We have several ways we can use this information:
@ RELATING
THE FREQUENCIES TO THE ATOMIC NATURE OF NUTRIENTS, with the Nutritional
Sounds Database.
The frequencies that are most
mentioned are important if they are from a toxic, but maybe they are taking
energy to its inverse frequency that could be a necessary nutrient. That
is the reason why it is convenient to study the frequencies and the inverse
frequencies. Always study a frequency and its inverse in the NS database.
@ RELATING
THE FREQUENCIES TO THE VOWEL SOUNDS as carrier of the intention and the
tone of the voice, our moods, our emotional soul expressing its true nature
in relationship with the universe, ourselves and our relationships with
other beings. We can use with frequencies the same ideas of the Biofeedback
techniques with notes in the IDEAS document from help.
@ RELATING
THE FREQUENCIES OF THE BIRTH DATE OF THE PERSON, OR THEIR PARENTS OR PARTNER,
between their different bithdays related to frequencies in the calibration
tables. Relating the interchange of empowering each other by reinforcing
certain nutrients with our relationship. Frequencies we share with
others and frequencies that interfere in the absorption of nutrients we
or others might need or are damaged by that frequencies interchange in
our energy exchange by talking to each other. Many practitioners
place a date of birth in the calibration table and we see the exact frequency
for the date of birth of the patient-participant with all the related frequencies
from the other notes. These seem to be especially significant if
the frequency it is close to any nutrient that the person may need. At
times the children need to be given as therapy the frequency of the birth
date of the mother. We can place any date in that calibration window
to see the frequencies related to the patient-participant.
FURTHER EXPLAINED IN THIS PAGE:
OUR AIM IS TO LOOK FOR CHANGES
IN THE VOICE THAT EXPRESS DIFFERENT PHYSICAL, EMOTIONAL AND MENTAL STATES.
TO KNOW WHEN ONE REACHES MUSICAL, HARMONIC COHERENCE AS IT SHOWS IN A BALANCE
OR RIGHT DISTRIBUTION OF FREQUENCIES AND NUMBER OF HITS BETWEEN ALL MUSICAL
NOTES.
THESE REPRESENT THE WHOLE
VIBRATIONAL SPECTRUM OF SOUND AND LIGHT.
BY UNDERSTANDING THE WAVELENGTH EACH PERSON NEEDS AT A GIVEN TIME, WE CAN DELIVER VIBRATIONAL THERAPY TO ASSIST IN BALANCING THE INDIVIDUAL TO SPECTRAL COHERENCE. THIS IS A BASIC NEED TO BOOST THE NATURAL HEALING SYSTEM OF THE BIOLOGICAL RHYTHM. THIS IS KNOWN IN OUR WORLD AS HEALTHY HAPPINESS AND BLISS.
![]()
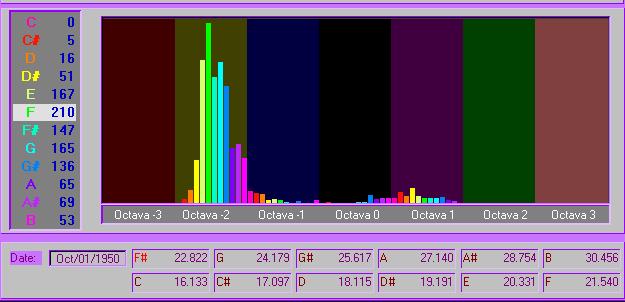
@ RELATING THE FREQUENCIES
TO THE ATOMIC NATURE OF NUTRIENTS, with the Nutritional Sounds Database.
The frequencies that are most
mentioned are important if they are from a toxic, but maybe they are taking
energy to its inverse frequency that could be a necessary nutrient. That
is the reason why it is convenient to study the frequencies and the inverse
frequencies. Always study a frequency and its inverse in the NS database.
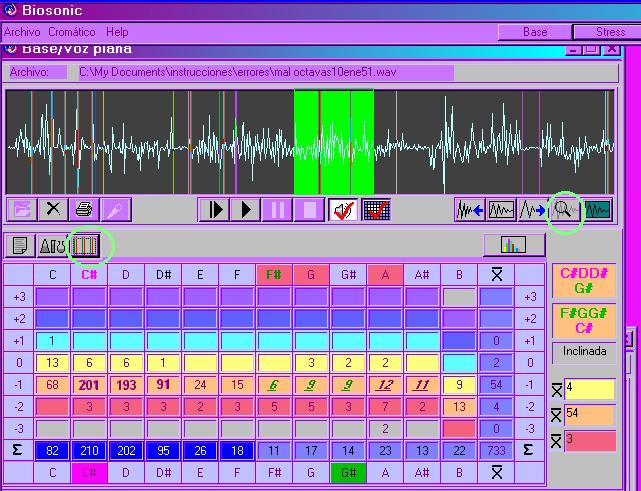
In the Cologram presentation activate the button of frequencies
zoom in the Main Octave, click in the high peaks look at this one or its
inverse by clicking on the 3 buttons where the frequency and its inverse
has entered, while activating the check to enter it in Nutritional SOunds
Database.
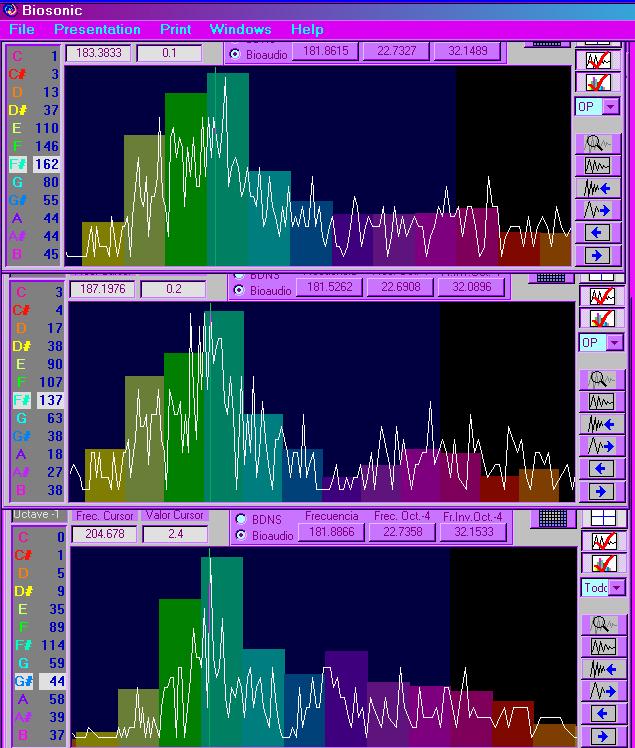
Three analysis of the seame person that show the same frequency
as a high peak in the different topics analysis Base, Stress and
Health. Looking at this one and its inverse it is important.
Frequency changes as a person gains coherence in analysis taken
at different times.
@ To decide which frequency is most important or needs to be given as therapy. By clicking on the button of COLORGRAM we can see the same analysis in colored bars for each note. By choosing in the menu window at the right of the window we can see the analysis with the colored bars of the notes for the Main Octave, the 6+ or 6- notes, 3+ or 3 notes. If you choose to activate the graphical Frequency button you will see all the frequencies, the line will have a point up, or down or just a slight bent corner where ever there is a frequency. In that place you have the frequency in the window of the cursor and the value of how many hits are with that same frequency. Click on that place and the frequency numbers will enter the 3 buttons for frequencies above this window. The number of frequencies for that note mentioned in the left side of this window has to coincide with the number of frequencies found. By summing up how many frequencies or hits come up in the value of the cursor at each corner angle of the line for each note, it might not coincide with the total for that note. This means that some are hidden, we can find them in the straight horizontal lines that have the same value or number of hits for several continuous frequencies. Click in the middle of that straight line or at a distance comparable to the corner angles that seem smaller in the other portions of the line.
The frequencies that are most mentioned are important if they are from a toxic, but maybe they are taking energy to its inverse frequency that could be a necessary nutrient. That is the reason why it is convenient to study the frequencies and the inverse frequencies.
Always study a frequency and its inverse in the NS database.
To be able to relate it to the Nutritional Sounds database list and decide which frequencies to give to the person as therapy. You have the number of that frequency, then also converted to the Beta -4 Octave, and the inverse frequency of this one. When the BioAudio is activated or checked, clicking one of the 3 buttons with frequencies it introduces that number directly in the BioAudio to generate a tone. When the Nutritional Sounds database is activated or checked you can look up in the database of minerals and vitamins any of the frequencies close to that one present in the voice.. These frequencies can help decide which one to give to a person comparing it to the database of minerals and vitamins, (which you have to buy separate from the BioSonic program). It is important that we look at what that frequency is or its inverse frequency, in either one there could be a key to their symptoms or problems in a psychological and physical level. . The Nutritional Sounds database is related to mass, or molecular weight, (both options are given in the NS database), being responsible for movement of mass in space, rhythm or chaos in its dance with other atomic elements.
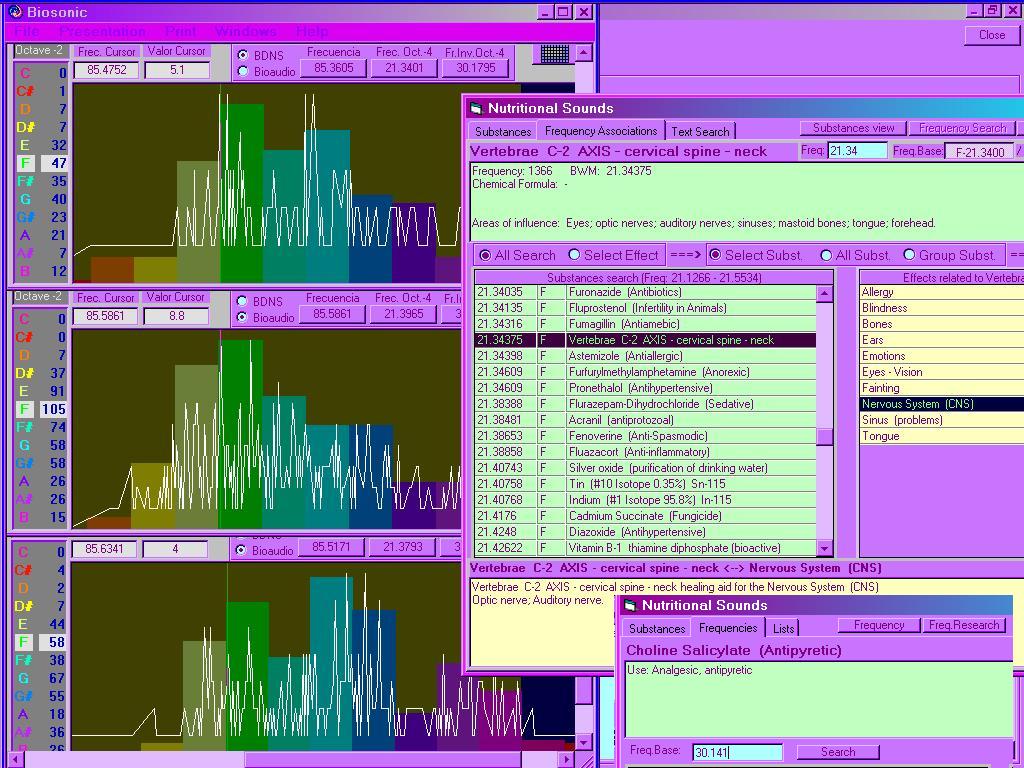
This person is in pain from pain in the neck due to
the cervicals and tension in the nerve and muscle around the neck. In the
last analysis when talking about the future the tension and peak highest
frequency relaxed. The inverse frequency in B relate to Choline
a analgesic pain relaxant that he might need to calm that pain down.
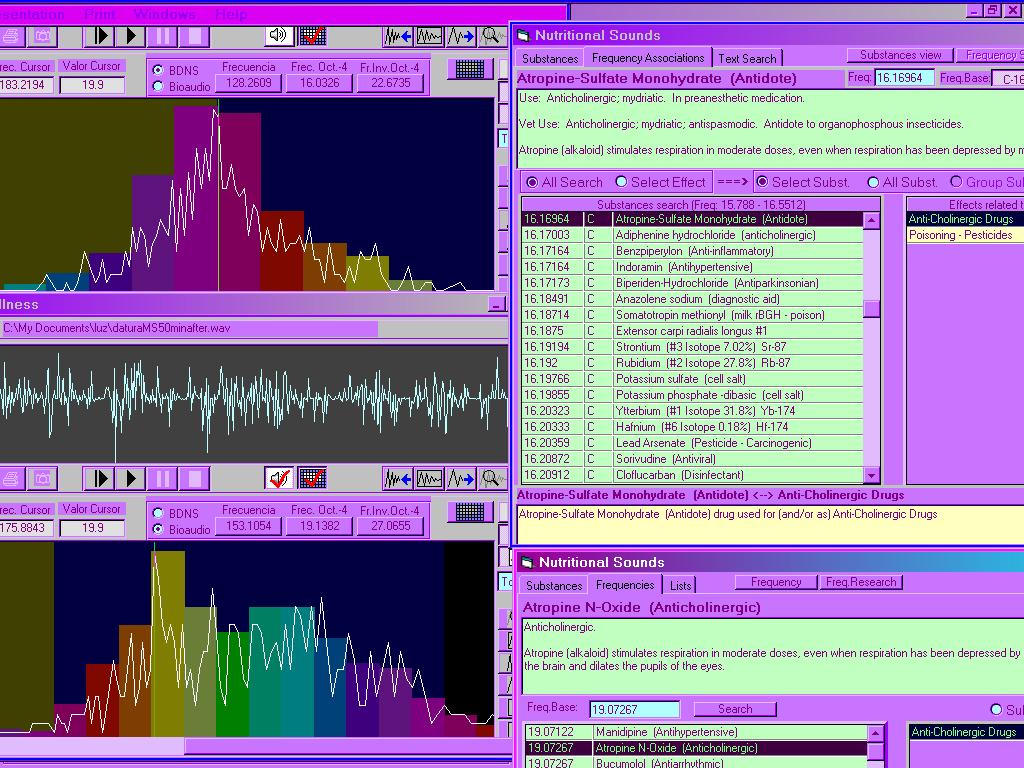
These are two different persons under intoxication by the
same drug compound that has a lot of Atropine and dilates the eye pupil
for eye surgery. As we can see the highest frequency is different
in both persons even though they are under the effect of the same drug,
with a more intoxication for the person in the above analysis. The
relationship of that drug with the NS database works for one person with
the Mass to frequency, Master Frequency conversion, and for the person
below with the relationship of Molecular weight to hertz conversion.
In another sense it pronounced in to more imbalance what they already had
before, and enhanced even more the note that person had in excess
. the Red Magenta in the person above and picked up more the frequency
of Atropine in that range of frequencies B of the Liver, and the person
of the analysis below had before and has more now in excess D# so it picked
up the Atropine frequency that relates to D# and affects the Gall Bladder.
THis only tells us that we absorbe more of what we already have frequencies
or the note that we already have a lot, and that the same nutrient or toxic
does not affect eerybody the same way, we could expect different
results for every person. Take this as a process of flexibility and
diversity in nature. We still have to research further the relationship
of the NS database with either type of conversion and take a decission
later how to work best with one type of calculation or the other. Always
remember to look at the frequency assotiation with the high peak excess
frequencies and its inverse in the third button above this screen
because this one we need to deliver to balance the voice, or the problem
could come from depressing the inverse frequency in the voice.
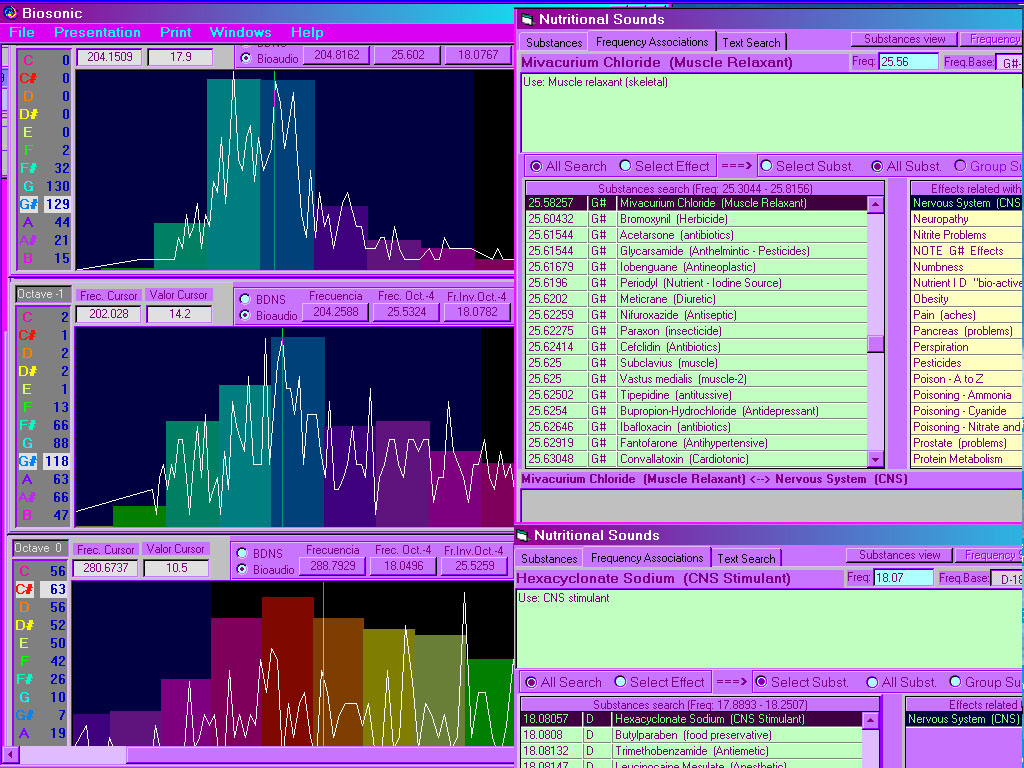
These 2 analysis are from a young girl with Multiple Sclerosis,
in a day with much pain and paralyzation sensation, and in
above and middle . Both analysisafter receiving a Cranio Sacral Therapy,
that helped regained some balance. We have two analysis with the
same high peak of muscle relaxant due to receiving therapy, that
day. The analysis below is of another day, when she is
normal and feels good and without pain. Everything is more balanced and
full and exactly the highest note and exact inverse frequency is
its highest. It is extraordinary that we can get hooked in a few
frequencies with their inverse frequency. Comparing several days or radical
changes is very unual, generally there are not such drastic changes.This
is a very sensitive girl and the mood changed so much between the first
analysis done when she is in pain, than when she feels good, them then
the frequency is a Nervous System stimulant.
These are from the young girl with Multiple Sclerosis, they are the same analysis as before going fruther to look at the high peaks and its inverse, in the top analysis we see how Vitamin B12 is the inverse of Cloroform, or Clorine in water that is not beneficial to her. But is her good day, good mood, good spirit, no pain. Meanwhile in the other bellow she has completely changed the notes, she is having a pain crisis and this is a rare case, where there is so much change, from one excess note to its inverse when she is bad . We find the medicine she is taking for Multiple Sclerosis in C# being low and its inverse being high in G# as muscle relaxant. Another example that the frequencies and their inverse work together when we should look at both in the NSdatabase. Many times we have to study the way we talk ,we say one note and immediately after its inverse.
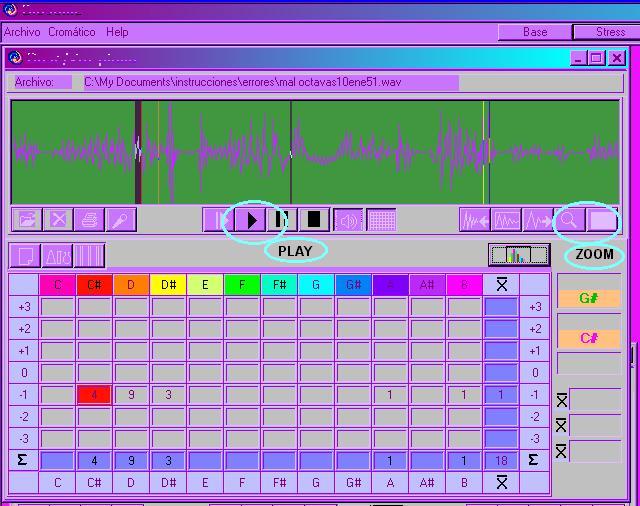
Mentioning one note and immediately after its inverse, study how exact are the frequencies in both notes. Abutton will show in the wav graphic all the lines in colors for the notes where we can find the note and immediately after its inverse. We can zoom in those sections of the wav and click on play and hear what the person said. Also having all the notes active, click on the notes you want to take out of the wav graphic, leave only the two notes you desire to study. By clicking directly on the cellbox of the note you desire the wav graphic gets drawn in lines in their corresponding color. By clicking again the lines will go out, the botton above will draw all of them, clicking on the cells will take them off or place them in the time sequence place of the wav recoding. This technique will allow to look for words mentioning certain notes, the most stress or the most weak, whatever is of interest to the pratitioner or researcher. If we play the sound and pick up to zoom a small section it would he heard a sound that is not distinguished what vowel sound it is... By zooming in a larger portion of the wav graphic we pick up a whole word and play the sound, we might hear a whole word and distinguish the vowel sound and the intonation and intention it carries when it was pronounced.
When choosing frequencies within
the range of a particular musical note taking into
accounts the spirals and all the parameters of the analysis of the Chromatic
and then help the organism to obtain harmony and vocal coherence.
In the first place we have the
weakest or lacking note that is important, look in the interpretation texts
to what
problems and organs it belong,
and later we have as high-priority the weakest note of the Yin spiral,
the 3 notes most
stressed that remove energy
to a particular note, to compare the interpretation of the most weak with
the weak note of the Yin spiral, decide which fits best with the pathologies
that the person shows, to choose the one that has most sense. If
3 analysis are done, Base, stress and future see if the spirals have maintained
in the three analyses of the different topics, or by comparing the
changes between one analysis and another. Another point to take into account
is when a multiple octave exists Cellular, mostly in the weak notes, maybe
the pathologies coincide better with this, therefore you would choose
frequencies inside the range of that note. We really have three weak
notes where to choose, the most weak, the weak one of Yin the spiral, that
of a multiple cellular octave, if the interpretation of the texts and the
patient- participant pathology doesn't help us to choose which is the most
important we can choose frequencies inside two notes and if the multiple
octave is important we would choose one of those, to produce coherence
it is most effective to choose one frequency within the range
of the weak note of the Yin spiral.
For example if the 6 weakest
are F #, G, G #, A, A #and B and the note that we want to give is G because
the 3 more
stressed are C #, D, and D #
that remove energy to G #, and the 3 weakest could be G #, A, A # that
give energy to D #,
we would choose G # as the note
most weak responsible for 3 more stressed, the weakest note is A # and
there is one
multiple octave in A, we would
choose a frequency in the range that tells us the boxcell when we leave
the cursor of the mouse between the notes G #and A, although the
note that most coincides with the person's pathologies it should be the
high-priority one.
Different
formulas that can be generated from a frequency. How
to create a CD of a frequency that we have already chosen.
To generate a wav that we can
use a BIOAUDIO module of the BIOSONIC SYSTEM. When recording a CD
we always have to make it in the format 44100 hertz, 16 bits and
a Compact Disc of audio will only recognize the first session, so that
all the frequencies and formulas that we give in this first session
will use de CD even though it occupies only 20 minutes or less than the
CD it will be the only one that will be recognized.
The BioAudio has many
options to Generate Tones and we add one frequency of one of their harmonics,
as indicated in the point 13 or continuing formulas as there. It is saved,
in the menu File, and submenu Save, in the format before mentioned (44100hz.16
bits). And you
open the program to create
CD's like Easy CD or the one that comes with the CD's recorder, that will
be used to burn the CD with the audio for therapy..
When creating two different
frequencies in both ears, we usually give the lowest frequency in the left
ear,
because the left hemisphere
of the brain wants what it lacks. But we can experience making it the other
way around,
mostly for people with right
brain dominance or whole brain dominance.
It is convenient to create two
frequencies that are harmonics from the other, and deciding to give a certain
frequency, either belonging to a mineral, vitamin or amino acid chosen
from the database, or another frequency decided by others
methods.
These formulas and treatment
methods will be seen and be analyzed in depth in the 4th module of
the program of
BIOSONIC, since when seeing
and to understanding the voice and the power of resonance of the sound
with the next two modules of FFT and COHERENCE we will understand
better the decisions of the frequencies that we should look for to give
treatment, and to create something more studied scientifically for the
4th module on SOUND THERAPY.
- How to charge
a quartz crystal with the frequency that a person needs.
Buy a quartz crystal of the
size of a finger more or less, always clean it energetically leaving it
in water with salt during one day more or less. Generate the desired frequency
with the BioAudio and then test the frequency tone by place the crystal
between the headphones, and if it is possible, place these inside
a copper box or surrounded of a copper foil, and place the crystal between
both headphones with the frequency during 15 minutes. Ask the person to
take it the closest possible to the skin and not on the air. If it has
been a lot of time with the charged quartz with their frequency in subways,
trains or airplanes, they will have to clean it again and to charge it
again. We have been able to see with an EEG that with the contact with
the skin of the person, the brain produces the charged frequency in the
quartz crystal very quickly, for that reason it is a valuable method
to deliver sound.
@ RELATING
THE FREQUENCIES TO THE VOWEL SOUNDS as carrier of the intention and the
tone of the voice, our moods, our emotional soul expressing its true nature
in relationship with the universe, ourselves and our relationships with
other beings. We can use with frequencies the same ideas of the Biofeedback
techniques with notes in the IDEAS document from help. Not only seeing
when one person gives themselves a certain frequency with their vowels
sound but also when another person gives them a certain frequency good
or bad with the tone of thir voice. Much researh is needed to be done in
this area and study of two persons voices and how they interact together,
analysing different types of conversations and voices.
What happens when we see the vowel sounds in another type of program as we will see in the FFTmodule of the BioSonic system.
Other type of analysis like
the FFT (Fourrier Frequency Transform algorithm) will show many more frequencies
to choose from and relate to the database. The FFT picks up all the frequencies
that we hear, by transforming to measurement all the three dimensional
harmonics sounding in the form of its environment, the resonant box of
the mouth. All the facial, tongue, teeth movements change the harmonics
frequencies and the shape of its enveloping in the harmonic cascades. See
the manual pages on FFTvowels.html, or the HARMONICsignature.html.
We will continue to study the way the fundamental frequencies of the voice
resonate to upper octaves via intervals or harmonics with an FFT that samples
the same as the Chromatic style analysis that we have now, to portray the
physical energy of the patient-participant through his/her voice.
The Chromatic type analysis that
we now have will give us the Vocal chords fundamental frequencies,
less changeable, because they belong to the physical condition of the person.
Meanwhile the FFT programs show the harmonics of these, or the modulation
done by the resonant box that is the mouth, teeth and nose with the breathing.
FFT is more changeable and less stable, because it belongs to emotional
intention and mental content or psychological issues. Click on the
peak line of the high note in the screen to study the most frequently used
frequencies that could relate to toxic elements, we always give as therapy
the inverse frequency of that one. Or zoom in the weakest note, study the
frequencies by clicking directly in the peaks shown in the graphic, these
peaks will be small, because these frequencies only appear a few times.
The frequency window with the bars of notes in the background show the
vertical height as the times a frequency has been mentioned, the higher
the peak the more times it has been mentioned, the value of the cursor
shows how many. If you have the Pro version in the General
window you can see the frequency graphic of each of the 3 analysis done,
each appearing in a different color. With this you will be able to tell
if that frequency or one close to it was mentioned in other recordings
and analysis processed. When comparing it to the Nutritional Sound database
if you find a nutrient, mineral, amino acid or vitamin belonging to the
low note that fits the characteristics of the persons symptoms, then you
can deliver that frequency as it is. Deliver the frequency of the voice
in the Mid C, -1 or 2 Octave through headphones, or in a low-4 octave
if they will hear it, then a subwoofer speaker is best, one can buy the
ones for computers, these will be good enough. . When we deliver a frequency
we do not generate that element, we help the brain recognize it and assimilate
it, so at times it is good to have those supplements also by pills or nutrients,
the sound will help its absorption.
@ RELATING THE FREQUENCIES OF THE BIRTH DATE OF THE PERSON, OR THEIR PARENTS OR PARTNER, between their different bithdays related to frequencies in the calibration tables. Relating the interchange of empowering each other by reinforcing certain nutrients with our relationship. Frequencies we share with others and frequencies that interfere in the absorption of nutrients we or others might need or are damaged by that frequencies interchange in our energy exchange by talking to each other. Many practitioners place a date of birth in the calibration table and we see the exact frequency for the date of birth of the patient-participant with all the related frequencies from the other notes. These seem to be especially significant if the frequency it is close to any nutrient that the person may need. At times the children need to be given as therapy the frequency of the birth date of the mother. We can place any date in the calibration window to see the frequencies related to the patient-participant, or if any of the dates of their family members dates relate in a particular way to a necessary nutrient or toxic element. We can also decide to give the person the nutrient belonging to a mineral or nutrient that is closest to the frequency belonging to their calibration date and that seems to relate to something beneficial to that person or that will help the symptoms that the person presents.
![]()
EXACTNESS OF THE BIOSONIC
PROGRAM
FFT VERSUS CHROMATIC MODULES,
(see with more graphics)
First I created a wav file with the CoolEDIT,, you can see in the screen the frequency been generated is 200.454 hz, on the center of the Generate tones screen where it says frequency components are the harmonics amplitude that we give when generating the tones, you see the fundamental frequency 1 has a very low amplitude, then the next 2nd and 4th harmonic also a los amplitude and teh 3rd and 5th harmonic quite a large amplitude. in the STS we can see smaller the 200 hz, from the fundamental. and in the Cromatic screen of the Biosonic Program and Frequency window we see exactly the number 200.454 hz, the exact hertz that were created. The Chromatic could have shown the harmonics 400, 600, 800, and 1000 hz of all the harmonics,,,, but it did not,,,, only showed the first frequency which is the fundamental,,,, meanwhile the harmonics have clearly much more amplitude. THe STS only shows a few harmonics because its screen only show a small range coming from Octave+1,,, it finishes in the harmonic of 600 hz.
We still have a resolution problem with these type
analysis, we are using sound cards of 16 bit 44800 hz. and we will be able
to
reach more exactitude and resolution when we can commercially
use cards of 24 bit and 96000 hz. which now start to become
at a reasonable prize and many musicians have these.
At the actual resolution of our sound card we still have some error of
resolution and we have calculated the errors in the
BioSonic Chromatic analysis, no matter if we show 4 decimals because of
this problem the windowing sampling gives us a range
of frequencies and tends to give us decimals within that range.
These are the calculated error, the two decimals
can be trusted coming from the -3 and -2 Octaves, the 1 decimal can be
trusted coming from the -1 and Mid C 0 octaves, the
exact hertz can be trusted coming from the +1 and +2 octaves, meanwhile
only a close relation to 2 hertz can be trusted in
the +3 octave.
With the FFT we hope to overcome better this problem
and be able to reach an error of 0.04 instead, meanwhile the actual programs
for voice analysis in FFT are within a 0.16 margin in error.
The fundamental frequency comes from the vocal chords,,, and the sound of vowels,, meanwhile the consonants are silent hissing sounds,,, I can demonstrate this with the small 2nd module I have of the program,, and I have included it in the manual.
NEXT GRAPHIC SHOWS THE PROOF THAT THE BIOSONIC PROGRAM
PICKS UP THE FUNDAMENTAL FREQUENCIES.
With the Coll Edit program was generated a Wav file
in Generate Tones , and the fundamental frequency is at a very small amplitude
as one can observe the amplitude is set at a very low volume for 200hz,
the 3rd and 5th harmonic are set at maximum volume or amplitude.. and the
BioSonic frequency window only shows the fundamental frequency of 200.454
hz.
This will not happen in such a clear manner when we
use lower frequencies, but it does portray this with such low amplitude
of the fundamental frequencies for octaves Mid C, and -1 octaves,,, for
-2 octave the amplitude of the fundamental frequency has to have a higher
amplitude to be picked up by the BioSonic program and for lower octaves
than this even higher amplitud, if not the BioSonic program might pick
up the higher amplitude harmonic.
BIOSONIC PROGRAM PROOF THAT PICKS UP FUNDAMENTAL FREQUENCY
This is an example that serves as proof or the exact
measurements and that the BIOSONIC PROGRAM only picks up the fundamental
frequency, I will go through how I did the test with the Cool Edit program,
Biosonic Program and STS for FFT analysis.
First I created a wav file with the CoolEDIT,, you
can see in the screen the frequency been generated is 200.454 hz, on the
center of the Generate tones screen where it says frequency components
are the harmonics amplitude that we give when generating the tones, you
see the fundamental frequency 1 has a very low amplitude, then the next
2nd and 4th harmonic also a los amplitude and teh 3rd and 5th harmonic
quite a large amplitude. in the STS we can see smaller the 200 hz, from
the fundamental. and in the Cromatic screen of the Biosonic Program and
Frequency window we see exactly the number 200.454 hz, the exact hertz
that were created. The Chromatic could have shown the harmonics 400, 600,
800, and 1000 hz of all the harmonics,,,, but it did not,,,, only showed
the first frequency which is the fundamental,,,, meanwhile the harmonics
have clearly much more amplitude. THe STS only shows a few harmonics because
its screen only show a small range coming from Octave+1,,, it finishes
in the harmonic of 600 hz.
For more understanding on
the difference between FFT and Chromatic analysis go to the pages on FFT
vowels.
![]()
![]() PSYHOLOGICAL
TYPES
PSYHOLOGICAL
TYPES
How to define the psychological types from the voice.
![]() OCTAVES
OCTAVES
How to define the octaves of the physical body, the emotional octaves
y and the celular octaves.
I-CHING
THE VIBRATIONAL EXPLANATION OF THE UNIVERSE ![]()
The dynamics of light and darkness describe the vibrational world
of color and sound.
COLOR, THE 5 ELEMENTS AND THE
I-CHING![]()
The Chromodynamics of the I-Ching is used to describe the 5 elements,
and the dynamics of vibration.
BIOFEEDBACK
AND THE USE OF PSYCHOLOGY WITH THE VOICE ![]()
The dynamics of light and darkness describe the vibrational world
of color and sound.
HOW EXACT IS THE BIOSONIC
PROGRAM![]()
Demonstrates how it picks up exactly the vibration of any audio
file and the fundamental frequencies.
COHERENCE RHYTHMS, ![]()
What it means to be coherent in all the body pulses, and how it
can help our state of health
![]() NUTRITIONAL
DATABASE
NUTRITIONAL
DATABASE
The molecular weight is related to sound, hertz.
![]() CALIBRATION
CALIBRATION
Why we need to personalize the notes to an individual birthdate.
HARMONIC'S![]()
What the principles of harmonics portray in nature and how we see
them.
GOLDEN MEAN, PHI RATIO![]()
Nature presents itself and grows in the proportion of Sacred
Geometry used by our ancestors to construct cathedrals and temples.
![]() CHANGES
IN THE VOICE
CHANGES
IN THE VOICE
How to see and define the changes in the voice.
![]() ALL
ABOUT LIGHT,
ALL
ABOUT LIGHT,
All we need to know about the discovery of the universe through
LIGHT.
![]() CHANGES
IN THE VOICE AND EXPERIMENTS WITH LIGHT,
CHANGES
IN THE VOICE AND EXPERIMENTS WITH LIGHT,
How to decide the notes to use with Ocular Light treatment and see
changes in the VOICE, EEG, and EKG.
COHERENCE
AND THE BELL CURVE![]()
How we can see Coherence in any vibratory element in nature and
in the BioSonic program.
![]() THE
NOTES AND THE COLORS
THE
NOTES AND THE COLORS
How to progress the notes through the octaves till one reachesl
the frequencies of light.
![]() COLOR
ACUPUNTURE MERIDIANS AND KINESIOLOGY
COLOR
ACUPUNTURE MERIDIANS AND KINESIOLOGY
How to use the information of notes and color from this program
with acupunture meridians and treatment with sound, tuning forks and
with the light with prisms or quartz crystals activated by a penlight
with filters.
![]() THE
SPIRALS AND THE COSMOS
THE
SPIRALS AND THE COSMOS
How all in the universe progress through spirals.
![]() THE
SPIRALES AND HUMAN BODY
THE
SPIRALES AND HUMAN BODY
How we see the spirals in the body.
![]() THE
IRIS AND THE BRAIN DOMINANCE
THE
IRIS AND THE BRAIN DOMINANCE
Some knowledges about Iridiology and how we can decide for Brain
dominance of a person.
![]()
![]()
To learn more on COHERENCE and
Voice Analysis contact the author of the BIOSONIC method and computer program
Marysol Gonzalez Sterling
![]()
![]() OTHER LINKS
OTHER LINKS
![]() COHERENCE
COHERENCE
return to first page on Voice Analysis & Coherence.
BIOSONIC![]() ,
,
Sound Therapy with voice analysis and treatament of brain resonance
with sound frequencies.
BIOSONIC
CRANIAL WITH DOLPHINS![]()
Sonic therapy with unwinding in the water accompanied by dolphins.
Cranio- Sacral Osteopathy with tuning forks. Voice analysis of brain frequencies.
![]() SACRO-CRANIAL
THERAPY,
SACRO-CRANIAL
THERAPY,
Energetic Osteopathy based on the movility of the cranium bones.
![]() BIOSONIC
CRANEAL,
BIOSONIC
CRANEAL,
Sacro-Cranial therapy with sound and tuning forks.
PHOTONIC![]()
Diagnosis and therapy of the missing color with prisms and solar
light.
![]() SONIC
TUNE UP,
SONIC
TUNE UP,
Holophonic Recording as Biosonic Cranial Therapy private session.
![]()
Calle
de la Fuentes 8, 3 izda.
Madrid 28013,
SPAIN.
telefono;
(34)91 5425597,
All year
e-Mail: planet.art@retemail.es
![]()
| INDEX |