| INDEX |
| INDEX |
 "BIOSONIC"
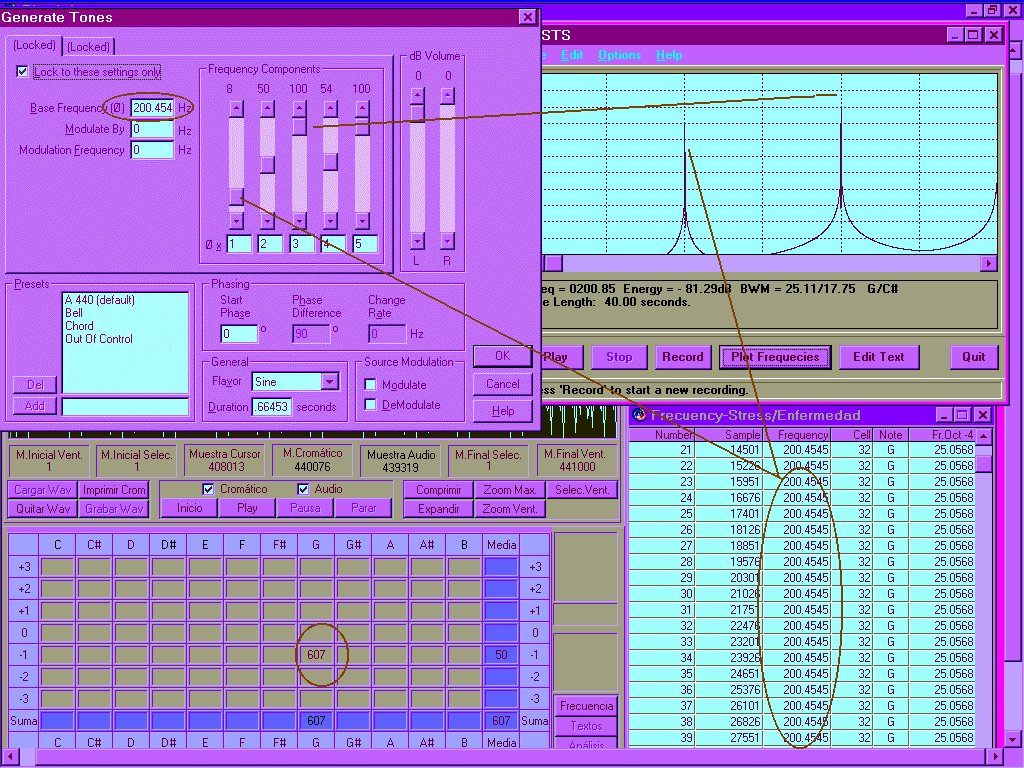
First I created a wav file with the CoolEDIT,, you can see in the screen the frequency been generated is 200.454 hz, on the center of the Generate tones screen where it says frequency components are the harmonics amplitude that we give when generating the tones, you see the fundamental frequency 1 has a very low amplitude, then the next 2nd and 4th harmonic also a los amplitude and teh 3rd and 5th harmonic quite a large amplitude. in the STS we can see smaller the 200 hz, from the fundamental. and in the Cromatic screen of the Biosonic Program and Frequency window we see exactly the number 200.454 hz, the exact hertz that were created. The Chromatic could have shown the harmonics 400, 600, 800, and 1000 hz of all the harmonics,,,, but it did not,,,, only showed the first frequency which is the fundamental,,,, meanwhile the harmonics have clearly much more amplitude. THe STS only shows a few harmonics because its screen only show a small range coming from Octave+1,,, it finishes in the harmonic of 600 hz.
We still have a resolution problem with these type
analysis, we are using sound cards of 16 bit 44800 hz. and we will be able
to
reach more exactitude and resolution when we can commercially
use cards of 24 bit and 96000 hz. which now start to become
at a reasonable prize and many musicians have these.
At the actual resolution of our sound card we still have some error of
resolution and we have calculated the errors in the
BioSonic Chromatic analysis, no matter if we show 4 decimals because of
this problem the windowing sampling gives us a range
of frequencies and tends to give us decimals within that range.
These are the calculated error, the two decimals
can be trusted coming from the -3 and -2 Octaves, the 1 decimal can be
trusted coming from the -1 and Mid C 0 octaves, the
exact hertz can be trusted coming from the +1 and +2 octaves, meanwhile
only a close relation to 2 hertz can be trusted in
the +3 octave.
With the FFT we hope to overcome better this problem
and be able to reach an error of 0.04 instead, meanwhile the actual programs
for voice analysis in FFT are within a 0.16 margin in error.
The fundamental frequency comes from the vocal chords,,, and the sound of vowels,, meanwhile the consonants are silent hissing sounds,,, I can demonstrate this with the small 2nd module I have of the program,, and I have included it in the manual.
NEXT GRAPHIC SHOWS THE PROOF THAT THE BIOSONIC PROGRAM
PICKS UP THE FUNDAMENTAL FREQUENCIES.
With the Coll Edit program was generated a Wav file
in Generate Tones , and the fundamental frequency is at a very small amplitude
as one can observe the amplitude is set at a very low volume for 200hz,
the 3rd and 5th harmonic are set at maximum volume or amplitude.. and the
BioSonic frequency window only shows the fundamental frequency of 200.454
hz.
This will not happen in such a clear manner when we
use lower frequencies, but it does portray this with such low amplitude
of the fundamental frequencies for octaves Mid C, and -1 octaves,,, for
-2 octave the amplitude of the fundamental frequency has to have a higher
amplitude to be picked up by the BioSonic program and for lower octaves
than this even higher amplitud, if not the BioSonic program might pick
up the higher amplitude harmonic.
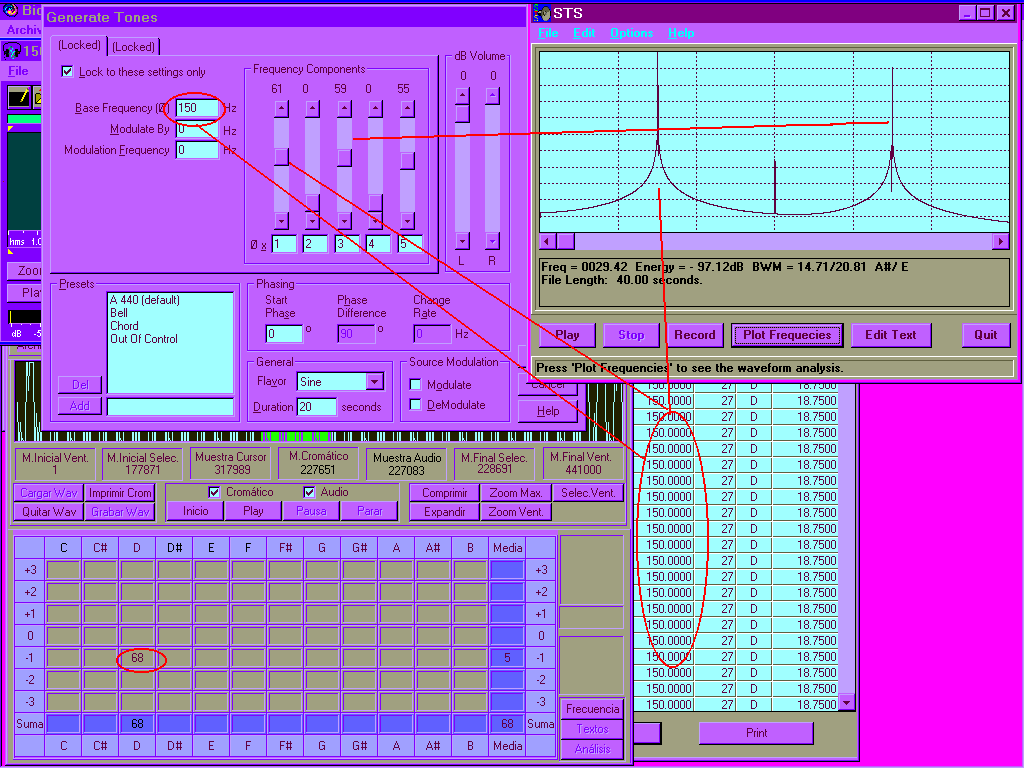
In the next graphic we see CoolEdit creatins 150 hertz
and how the Biosonic Frequency window has given the exact frequency the
first fundamental frequency,, meanwhile in the CoolEdit Generating tones
at the same amplitude we generated the 3rd and 5th harmonic, the Chromatic
does not show it and the STS FFT window will show these harmonics.
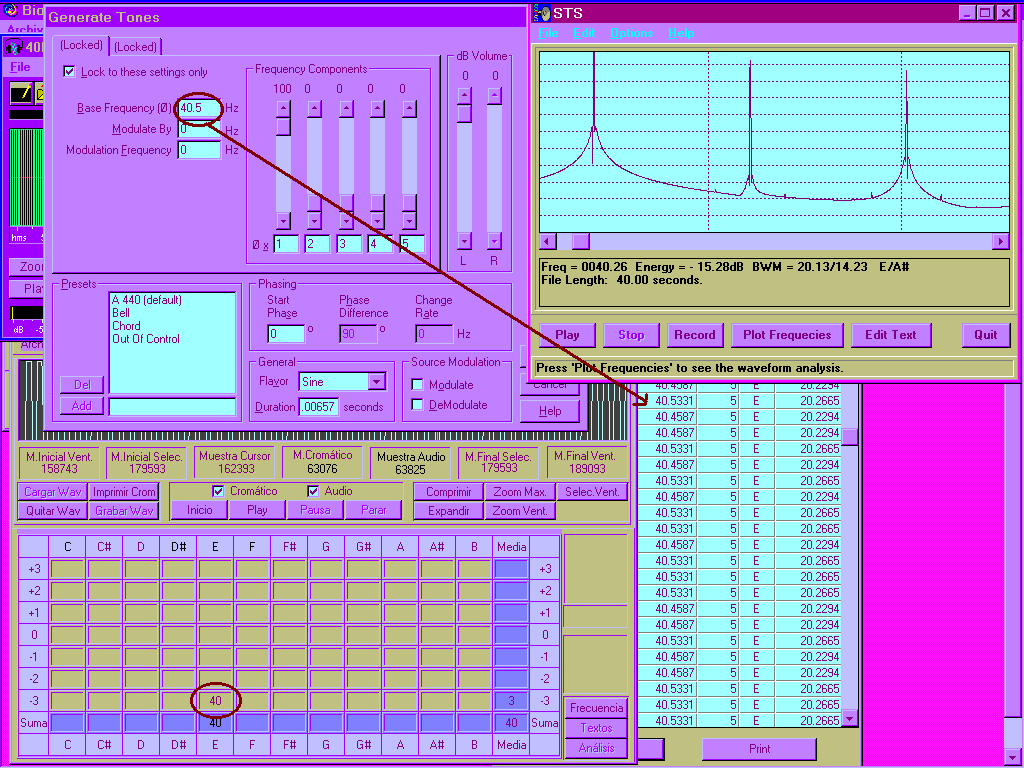
Now in this new graphic we see 40.5 hertz has been generated with no harmonics in the Cool Edit generating Tones indow,,, the BioSonic frequency window will show it with much exactitude and the STS FFT window will show this one in a more aproximation as well as its harmonics. Even if these where not generated with Cool Edit... Just by maintaining a frequency for a while it will give its harmonics.
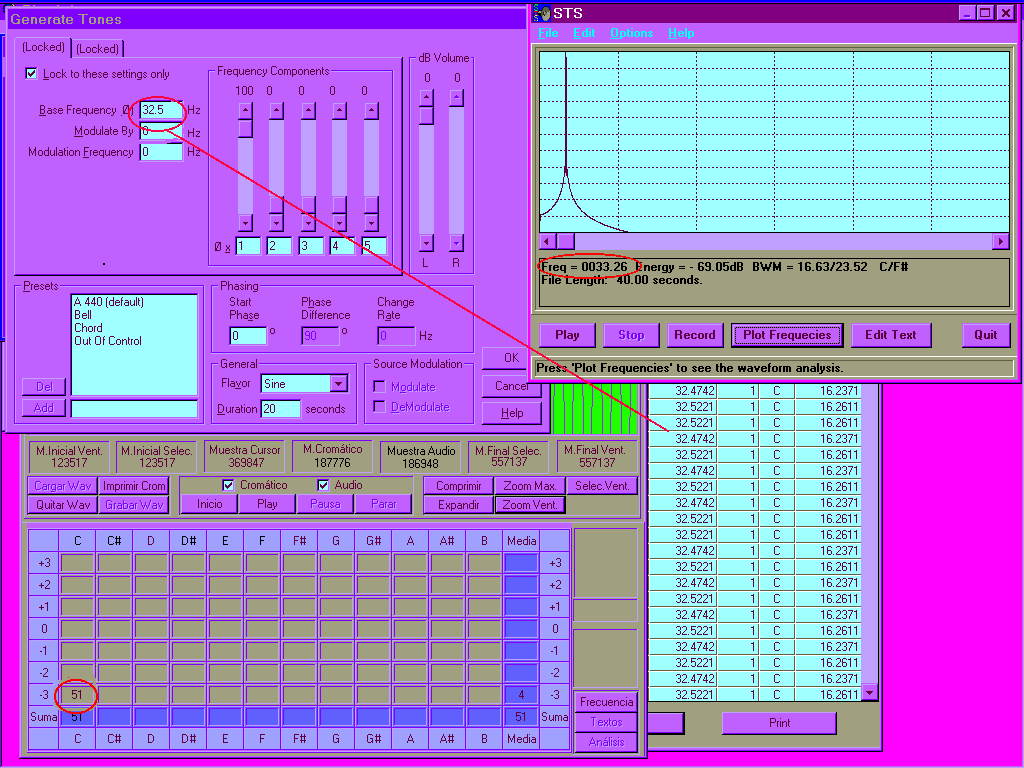
THis third graphic shows how exact the BioSonic program shows the frequencies even down to 32.5 hertz, at times it is 32.5221 and others 32.4742, this is very good for such a low frequency. It shows it with more exactness than the STS FFT where it shows 33.26 hz.
BIOSONIC PROGRAM PROOF THAT PICKS UP FUNDAMENTAL FREQUENCY
This is an example that serves as proof or the exact
measurements and that the BIOSONIC PROGRAM only picks up the fundamental
frequency, I will go through how I did the test with the Cool Edit program,
Biosonic Program and STS for FFT analysis.
First I created a wav file with the CoolEDIT,, you
can see in the screen the frequency been generated is 200.454 hz, on the
center of the Generate tones screen where it says frequency components
are the harmonics amplitude that we give when generating the tones, you
see the fundamental frequency 1 has a very low amplitude, then the next
2nd and 4th harmonic also a los amplitude and teh 3rd and 5th harmonic
quite a large amplitude. in the STS we can see smaller the 200 hz, from
the fundamental. and in the Cromatic screen of the Biosonic Program and
Frequency window we see exactly the number 200.454 hz, the exact hertz
that were created. The Chromatic could have shown the harmonics 400, 600,
800, and 1000 hz of all the harmonics,,,, but it did not,,,, only showed
the first frequency which is the fundamental,,,, meanwhile the harmonics
have clearly much more amplitude. THe STS only shows a few harmonics because
its screen only show a small range coming from Octave+1,,, it finishes
in the harmonic of 600 hz.
If we created the fundamental frequency in such low amplitude as it is here shown with 200hz, or below 80 hz. it will not recognize it, and if then the harmonics where generated in these low frequency with so much amplitude and strength it might pick up that harmonic as a fundamental frequency, but we can trust completely that it will pick up the fundamental frequencies in the the range of the human voice above 50 hz. even if the fundamental is much lower in amplitude than its harmonics.
HOW WE STARTED TO LOOK FOR THE MAIN OCTAVE FROM THE FFT MODULE
I wanted to have a Chromatic style analysis that would give us the Main Octave but with more resolution, because the Korg Chromatic tuner would miss many hits, and even more with low mens voices. We started doing an FFT that would pick up the most ample frequency and place it into the corresponding cellbox for the corresponding note and octave. Then what we found was not the same as what expected or analysed before with the Korg, The Main Octave seemed to have risen one whole octave, wimen would have a childs voice, and men would have a womans voice. When you hear the notes in the Mid C octave it is clear that wimen had lower voices than that. Then we realized that the frequency with most amplitude most of the times was the 3rd and others the 5th harmonic, few times it was the first or fundamental frequency. Tha is the reason we did more tests with the Korg to understand how we could give more potency to the fundamental frequency, and then we came up with the way to pick it up directly from the wav, without needing an FFT type analysis. Here we have the voice of a woman with the first BioSonic FFT module which is very coherent as we can see in the graphic below these lines we can still recognize the main octave, but the G, G# A are higher in its first harmonic in a higher octave MidC instead of -1 octave. Anothe example of a mans voice will give us the -1 and Mid C octaves as the Main octaves with more hits, insteas as what it shows in the graphic below of the program we have now, where a mans voice is naturally in the -2 ands -1 octaves. Because it is not coherent it is also hard to decipher the Main Octave from this analysis.
PSYHOLOGICAL
TYPES
How to define the psychological types from the voice.
OCTAVES
How to define the octaves of the physical body, the emotional octaves
y and the celular octaves.
I-CHING THE
VIBRATIONAL EXPLANATION OF THE UNIVERSE
The dynamics of light and darkness describe the vibrational world of
color and sound.
COLOR, THE 5 ELEMENTS AND THE I-CHING
The Chromodynamics of the I-Ching is used to describe the 5 elements,
and the dynamics of vibration.
BIOFEEDBACK
AND THE USE OF PSYCHOLOGY WITH THE VOICE
The dynamics of light and darkness describe the vibrational world of
color and sound.
HOW EXACT IS THE BIOSONIC PROGRAM
Demonstrates how it picks up exactly the vibration of any audio file
and the fundamental frequencies.
COHERENCE RHYTHMS,
What it means to be coherent in all the body pulses, and how it can help
our state of health
NUTRITIONAL
DATABASE
The molecular weight is related to sound, hertz.
CALIBRATION
Why we need to personalize the notes to an individual birthdate.
HARMONIC'S
What the principles of harmonics portray in nature and how we see them.
GOLDEN MEAN, PHI RATIO
Nature presents itself and grows in the proportion of Sacred Geometry
used by our ancestors to construct cathedrals and temples.
CHANGES
IN THE VOICE
How to see and define the changes in the voice.
ALL
ABOUT LIGHT,
All we need to know about the discovery of the universe through LIGHT.
CHANGES
IN THE VOICE AND EXPERIMENTS WITH LIGHT,
How to decide the notes to use with Ocular Light treatment and see changes
in the VOICE, EEG, and EKG.
COHERENCE
AND THE BELL CURVE
How we can see Coherence in any vibratory element in nature and in the
BioSonic program.
THE
NOTES AND THE COLORS
How to progress the notes through the octaves till one reachesl the frequencies
of light.
COLOR
ACUPUNTURE MERIDIANS AND KINESIOLOGY
How to use the information of notes and color from this program with
acupunture meridians and treatment with sound, tuning forks and with
the light with prisms or quartz crystals activated by a penlight with
filters.
THE
SPIRALS AND THE COSMOS
How all in the universe progress through spirals.
THE
SPIRALES AND HUMAN BODY
How we see the spirals in the body.
THE
IRIS AND THE BRAIN DOMINANCE
Some knowledges about Iridiology and how we can decide for Brain dominance
of a person.
To learn more on COHERENCE and
Voice Analysis contact the author of the BIOSONIC method and computer program
Marysol Gonzalez Sterling


![]() OTHER LINKS
OTHER LINKS
COHERENCE
return to first page on Voice Analysis & Coherence.
BIOSONIC,
Sound Therapy with voice analysis and treatament of brain resonance
with sound frequencies.
BIOSONIC
CRANIAL WITH DOLPHINS
Sonic therapy with unwinding in the water accompanied by dolphins.
Cranio- Sacral Osteopathy with tuning forks. Voice analysis of brain frequencies.
SACRO-CRANIAL
THERAPY,
Energetic Osteopathy based on the movility of the cranium bones.
BIOSONIC
CRANEAL,
Sacro-Cranial therapy with sound and tuning forks.
PHOTONIC
Diagnosis and therapy of the missing color with prisms and solar light.
SONIC
TUNE UP,
Holophonic Recording as Biosonic Cranial Therapy private session.
| INDEX |